

Building Performance Analytics
Powered by building analytics experts Maalka™, START™ enables you to track, visualize and validate your energy, emissions, water and waste data.


How it works:
Simply enter or upload your utilities data into the START Spreadsheets to generate graphics of consumption (energy & water) and generation (waste & emissions).
>> Export-import of Energy Star Portfolio Manager™, copy-paste from existing spreadsheets, or enter manually.
Store building data, files and bills in a central database.
Communicate with team members through annotations and comments.
Benchmark and compare performance
Identify areas for improvement
Promote transparency and accountability
Track progress towards sustainability goals
Create structure and promote program continuity
Monitor the efficacy of interventions
Support decision-making and budgeting
Use data to improve efficiencies and motivate behavior change
-
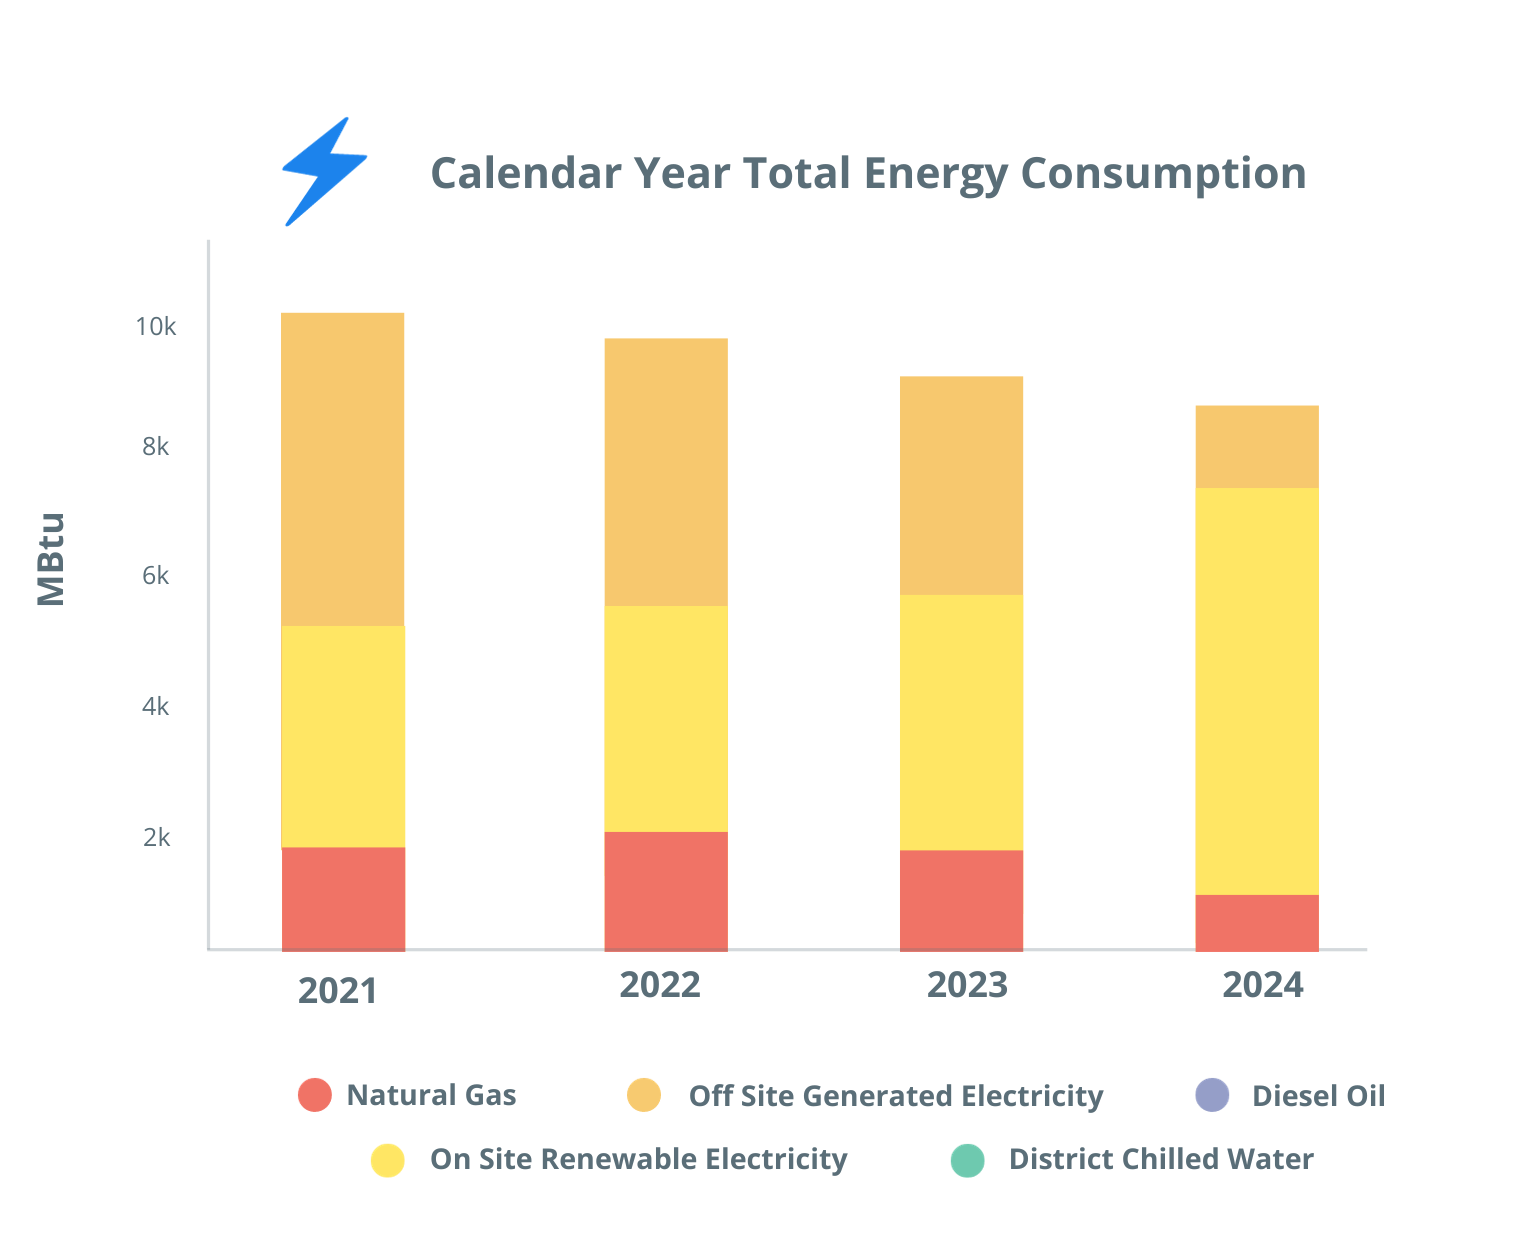
Benchmark, set goals and track progress for energy efficiency and your transition to renewable energy.
-
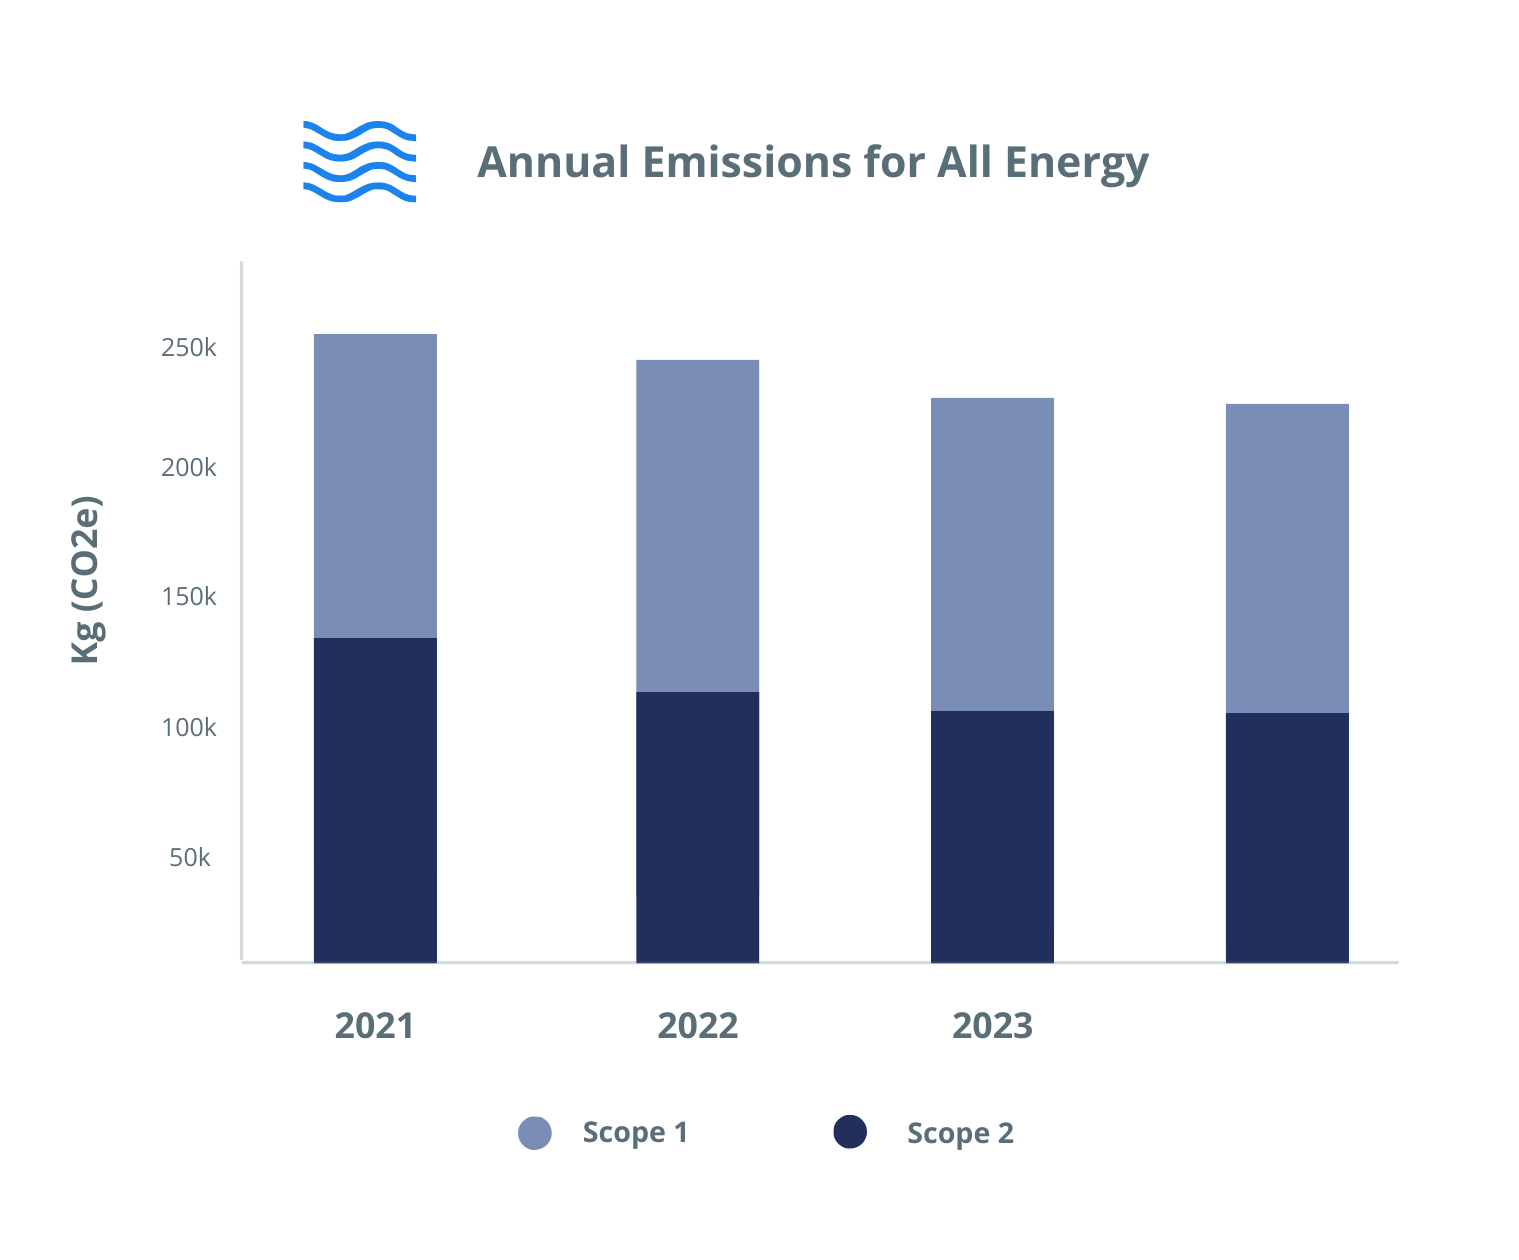
Based on your energy data and location, START automatically generates estimations of Scope 1 and 2 emissions. (Scope 3 coming soon!)
-
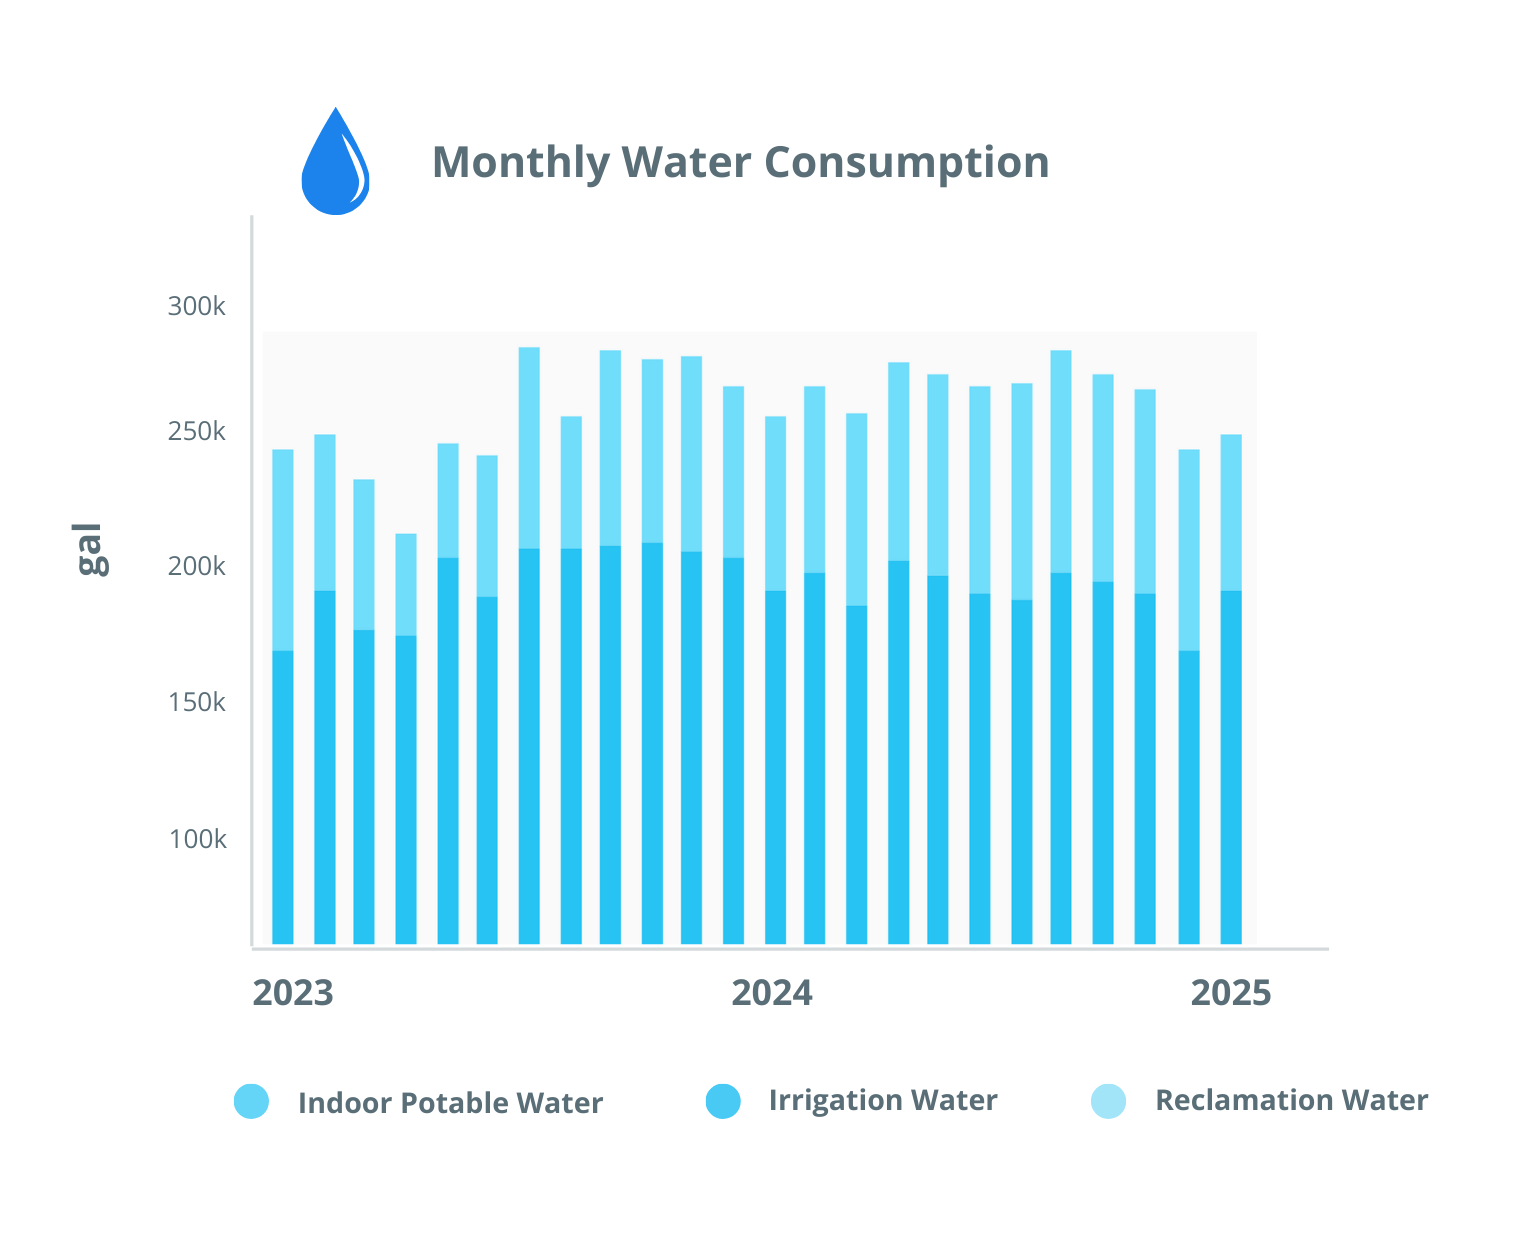
Input your school's water use and the tool will generate graphics to support tracking and analyzing consumption by type and time.
-
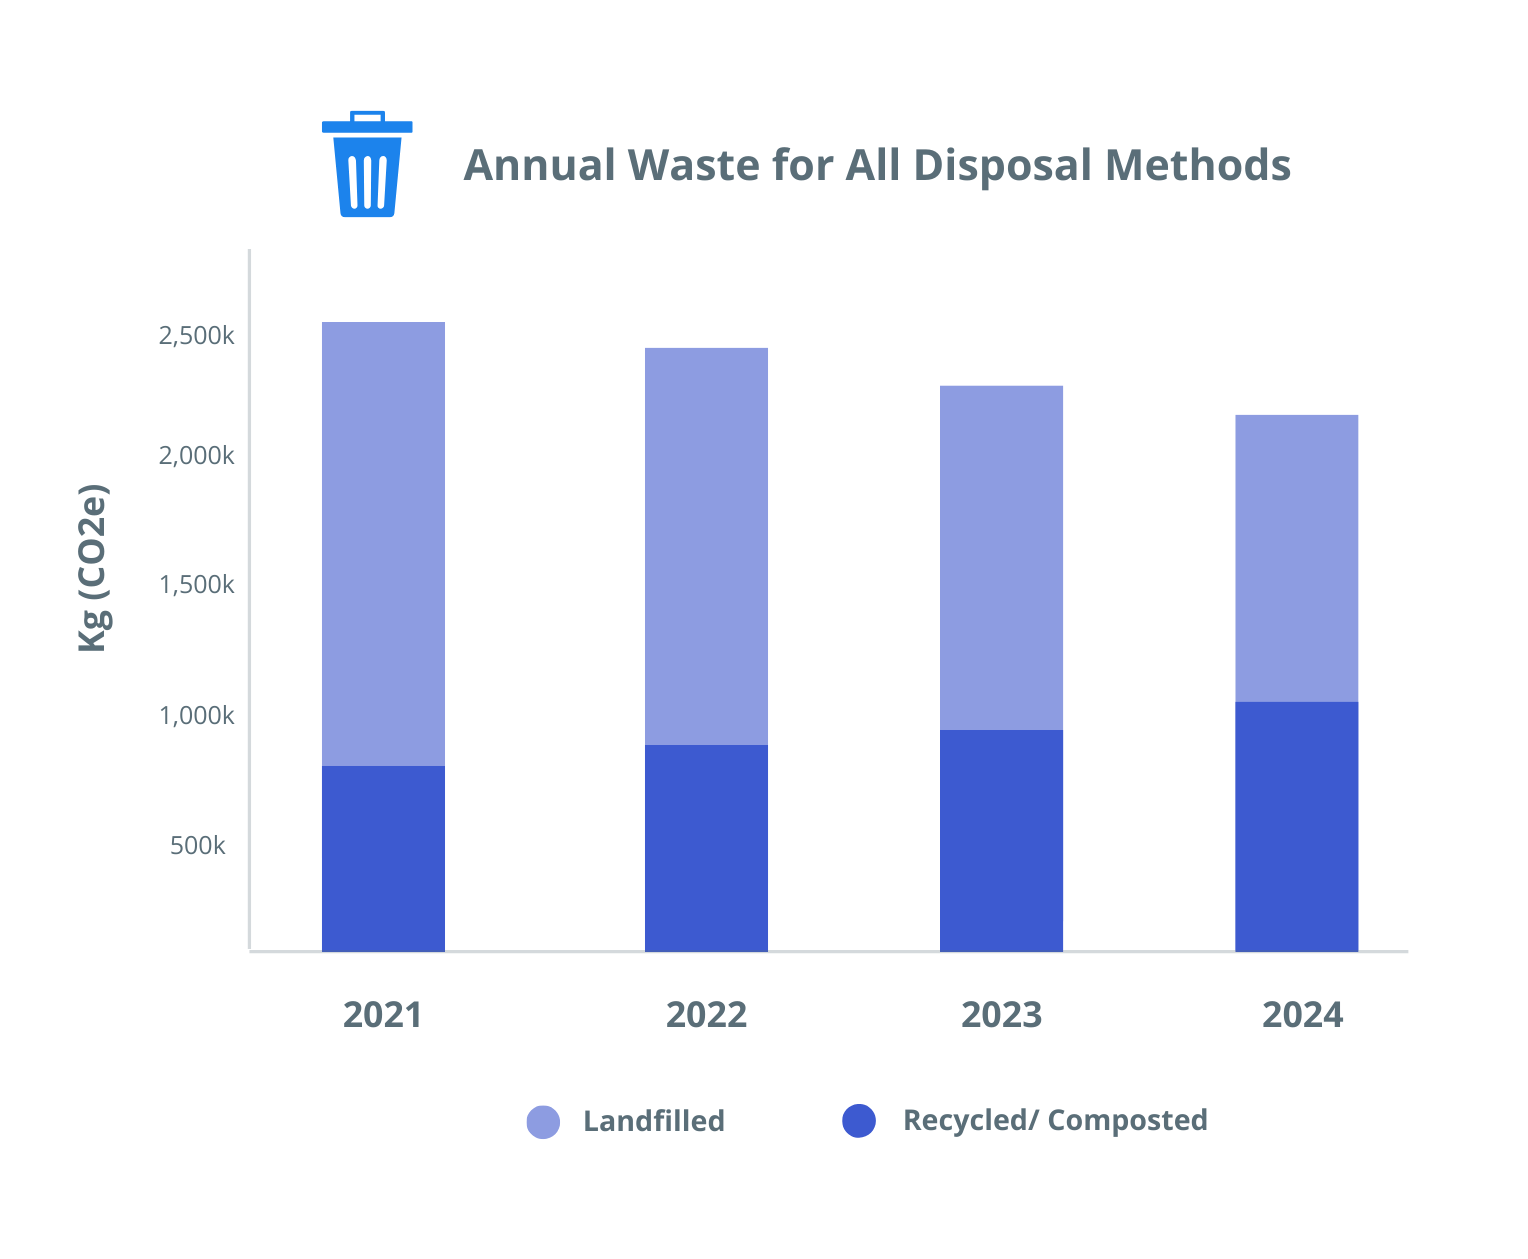
Quantify your disposal practices and use visualizations to track your progress and set new goals.

Learn more about START’s Sustainable Building Analytics.
